If you deploy any type of application on AWS, such as a Ruby on Rails web app; then your application will generate large amounts of logs. Hence, you will need to store and monitor these logs somewhere to understand what is going on when an unexpected event occurs. A central log server may be a choice; however, Amazon CloudWatch offers an alternative way without maintaining your log servers and with lots of capabilities.
In today’s blog post, I will describe how you can start storing your application logs on Amazon CloudWatch by using a Ruby on Rails web application as an example. The same principles here would apply to other types of application logs as well.
What is Amazon CloudWatch Logs?
Amazon CloudWatch is the monitoring service of AWS for your resources and applications. Basically, you can monitor state of your AWS resources such as CPU usage of your EC2 instances, current connections on your RDS instances etc… It is the central of sys-ops administration on AWS. Your resources can stream metrics and logs to CloudWatch and you can monitor or set alarms and define automatic reactions to certain events using SNS, Lambda, etc.
Amazon CloudWatch Logs is the subservice of Amazon CloudWatch which enables you to collect and monitor log data from your applications and define metrics on them such as number of error messages. For instance, your Lambda functions can stream their logs on CloudWatch if you enable and grant necessary permissions to put their logs on CloudWatch and generate streams.
This blog post will be an introduction to CloudWatch Logs terminology, configuring our EC2 instances to collect Rails application logs and storing them on CloudWatch. Metric definitions will not be in this article to keep it simple.
Introduction to CloudWatch Logs terminology
As we discussed what CloudWatch and CloudWatch Logs are, let’s continue by explaining some of the terminology.
Log groups: If CloudWatch is your central place for all of your logs, then you need to group them according to their purpose, right? Log groups are for this purpose. You group your log streams in CloudWatch Log groups. To give an example, if you have a Ruby on Rails web application and a Lambda function for another purpose, you should put logs of these to applications in different Log groups. Technically, you can put them in the same group, but would not be a best practice.
Log streams: In an application you can have different files to collect data and these files may have different log structures. For every file, you define a different log stream in a log group. For example,
production.logfile in your Ruby on Rails application in an instance may be a log stream andproduction.logfile in another instance may be a different stream. Actually, they are different files as they are on different instances. Or you may have Sidekiq workers running on your instance which write log tosidekiq.logfile. Then this would be another log stream.Log events: Your application produces logs for certain events, such as a POST request and creation of a resource in a database. A log event is a record of this event by the application in the log file you monitor. A log event consists of two parts: The timestamp when the event occured and the raw log message. Think of these as rows in your log file.
The CloudWatch Log agent: You can develop your own logging interface to Amazon CloudWatch Logs by using AWS SDKs. However, there is a more easy way to do which I will discuss here. The CloudWatch Logs agent is a daemon provided by AWS that monitor your log files and push data to Amazon CloudWatch.
Granting IAM Permissions to stream logs to CloudWatch
Before begin, we need to grant permissions to our instance to be able to send logs to CloudWatch. The IAM role attached to your EC2 instance should have a custom policy with the permissions below. Please create an IAM role and attach to your instance if you have not done so.
{
  "Version": "2012-10-17",
  "Statement": [
    {
      "Effect": "Allow",
      "Action": [
        "logs:CreateLogGroup",
        "logs:CreateLogStream",
        "logs:PutLogEvents",
        "logs:DescribeLogStreams"
    ],
      "Resource": [
        "arn:aws:logs:*:*:*"
    ]
  }
 ]
}
With the help of these permissions, The CloudWatch Log agent will be able to create log groups, streams and put log events to these streams.
Installing The CloudWatch Logs agent on EC2 instance
Now, we need to install The CloudWatch Logs agent on our EC2 instance. I assume that AWS command line interface is installed and configured on your instance. I use Amazon Linux instances in this post as they have AWS CLI installed already.
Before installing, run “yum update” to get the latest repositories.
$ sudo yum update -y
...
Updated:
  authconfig.x86_64 0:6.2.8-30.31.amzn1      bash.x86_64 0:4.2.46-28.37.amzn1      curl.x86_64 0:7.51.0-9.75.amzn1      glibc.x86_64 0:2.17-196.172.amzn1      glibc-common.x86_64 0:2.17-196.172.amzn1
  libcurl.x86_64 0:7.51.0-9.75.amzn1         wget.x86_64 0:1.18-3.27.amzn1

Complete!
Let us install The CloudWatch Logs agent.
$ sudo yum install -y awslogs
...
Installed:
  awslogs.noarch 0:1.1.2-1.10.amzn1

Dependency Installed:
  aws-cli-plugin-cloudwatch-logs.noarch 0:1.3.3-1.15.amzn1

Complete!
For Ubuntu and other Linux distributions, you can see AWS documentation in the references section.
Configuring The CloudWatch Logs agent to watch Rails logs
When installed, The CloudWatch Logs agent comes with a default listening of /var/log/messages file. We need the make changes in agent’s configuration file to enable watching our Rails app logs.
Agent’s configuration file is at /etc/awslogs/awslogs.conf and the configuration is as below.
[general]
state_file = /var/lib/awslogs/agent-state

[/var/log/messages]
datetime_format = %b %d %H:%M:%S
file = /var/log/messages
buffer_duration = 5000
log_stream_name = {instance_id}
initial_position = start_of_file
log_group_name = /var/log/messages

[my_app_stream]
log_group_name = MyAppGroup
log_stream_name = {instance_id}
datetime_format = %Y-%m-%dT%H:%M:%S.%f
file = /var/www/my-app/current/log/production.log*
In agent’s configuration file sections for every logfile is defined between brackets and [my_app_stream] defines the configuration section for our Rails application’s log file.
As can be predicted, log_group_name is the name of the CloudWatch log group that the logs will be streamed into. Also, log_steram_name is the name of the corresponding log stream. Here, we use a variable using curly brackets as {instance_id} to use id of our EC2 instance as log stream name. You can do this differently, but if you are running multiple instances, you will most probably need to define different streams for each instance to enhance monitoring.
Rails logs has datetime format as %Y-%m-%dT%H:%M:%S.%f by default such as 2017-10-01T14:06:09.614567 and we define this in datetime_format attribute. Using this info, CloudWatch Logs will be able to parse our logs into datetime and messages.
Finally, we define the place of our log file in file atribute. This is the place where your web application’s log file resides. Using an asterix (*) enables CloudWatch to watch all files following production.log.
Start Amazon CloudWatch Logs agent to stream the logs
The last thing remaining is to start the log agent service to make our configuration active.
$ sudo service awslogs startAlso for starting awslogs service in instance reboot:
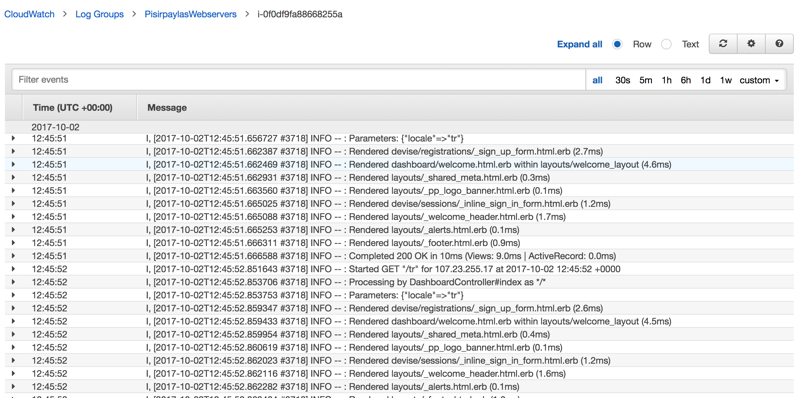
$ sudo chkconfig awslogs onAfter a while, you will see the logs from your Rails app flowing into CloudWatch Logs. You can monitor these logs from the AWS Management Console by going to “CloudWatch service -> Logs -> MyAppGroup -> instance_id”.
Here is an example screenshot from our Ruby on Rails web application logs (Pisirpaylas) on AWS Management Console:
Conclusion
As can be seen, you can store and monitor your Ruby on Rails or any other application’s logs on CloudWatch Logs Console. What else can you do? You can define a metric to filter error messages and trigger a Lambda function if the number of errors exceeds a certain treshold. You can extract this logs to Amazon S3 and save them for later. Also you can define a retention period such as 7 days for your CloudWatch Logs Group. In this case, logs older than 7 days will be automatically deleted.
This was an introduction to Amazon CloudWatch Logs with a Ruby on Rails example. I am planning to get into more features of CloudWatch Logs at later posts. I hope this post can give you an idea on how you can make use of CloudWatch Logs for your applications.
Thanks for reading!